Algorithm
The MultiMatch method is a vector-based, multi-dimensional approach to compute scan path similarity. It was originally proposed by Jarodzka, Holmqvist & Nyström (2010) and implemented as a Matlab toolbox by Dewhursts and colleagues (2012).
The method represents scan paths as geometrical vectors in a two-dimensional space: Any scan path is build up of a vector sequence in which the vectors represent saccades, and the start and end position of saccade vectors represent fixations. In the example image below, the scan path is build by connecting the fixations (red dots) with vectors (black lines), which constitute simplified saccades.
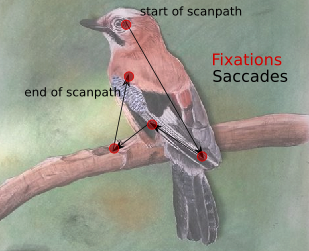
Example scan path as used in the MultiMatch algorithm
Two such sequences (which can differ in length) are compared on the five dimensions vector shape, vector length (saccadic amplitude), vector position, vector direction and fixation duration for a multidimensional similarity evaluation.
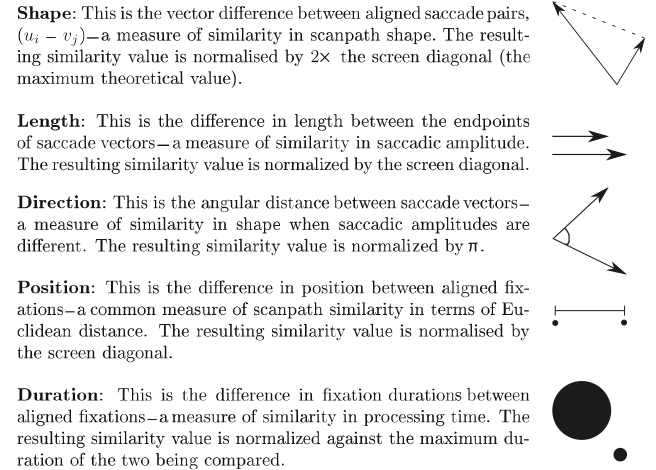
Dimensions of scan path comparison, taken from Dewhurst et al., 2012
Overview
The method takes two n x 3 fixation vectors (x-coordinate in px, y-coordinate in px, duration in sec) of two scan paths as its input. Example files how input should look like can be found here.
Step 1: Representation of scan paths as vector sequences
An idealized saccade is represented as the shortest distance between two fixations. The Cartesian coordinates of the fixations are thus the starting and ending points of a saccade. The length of a saccade in x direction is computed as the difference in x coordinates of starting and ending point. The length of a saccade in y direction is computed accordingly. To represent a saccade as a vector in two-dimensional space, the lengths in x and y directions are transformed into polar coordinates (length from coordinate origin (Rho), polar angle in radians (Theta)) by means of trigonometry.
Step 2: Scanpath simplification
Scanpaths are simplified based on angle and amplitude (length) to reduce their complexity. Two or more saccades are grouped together if angles between two consecutive saccades are below an angular threshold TAmp, and intermediate fixations are shorter than a duration threshold TDur, or if the amplitude of successive saccades is below a length threshold TAmp and the surrounding fixation duration. As such, small, locally contained saccades, and saccades in the same general direction are summed to form larger, less complex saccades (Dewhurst et al., 2012). This process is repeated until no further simplifications are made. Thresholds can be set according to use case. The original simplification algorithm implements an angular threshold of 45° and an amplitude threshold of 10% of the screen diagonal (Jarodzka, Holmqvist & Nyström, 2010).
Step 3: Temporal alignment
Two simplified scan paths are temporally aligned in order to find pairings of saccade vectors to compare. The aim is not necessarily to align two saccade vectors that constitute the same component in their respective vector sequence, but those two vectors that are the most similar while preserving temporal order. In this way, a stray saccade in one of the two scan paths does not lead to an overall low similarity rating, and it is further possible to compare scan paths of unequal length. To do so, all possible pairings of saccades are evaluated in similarity by their shape (i.e. vector differences). More formally, the vector difference between each element i in scan path S1 = (u1, u2, …, um) and each element j in scan path S2 = (v1, v2, …, vn) is computed and stored in Matrix M as a weight. Low weights correspond to high similarity. An adjacency matrix of size M is build, defining rules on which connection between matrix elements are allowed: In order to take temporal sequence of saccades into account, connections can only be made to the right, below or below-right. Together, matrices M and the adjacency matrix constitute a matrix representation of a directed, weighted graph. The elements of the matrix are the nodes, the connection rules constitute edges and the weights define the cost associated with each connection.
Step 4: Scanpath selection
A Dijkstra algorithm (Dijksta, 1959) is used to find the shortest path from the the first two saccade vectors to the last two saccade vectors. “Shortest” path is defined as the connection between nodes with the lowest possible sum of weights.
Step 5: Similarity calculation
Five measures of scan path similarity are computed on the aligned scan paths. This is done by performing simple vector arithmetic on all aligned saccade pairs, taking the median of the results and normalizing it. As a result, all five measures are in range [0, 1] with higher values indicating higher similarity between scan paths on the given dimension.
For a more detailed overview of the algorithm, take a look at the original publication by Dewhurst et al. (2012) and Jarodzka et al. (2010).
References
Dewhurst, R., Nyström, M., Jarodzka, H., Foulsham, T., Johansson, R., & Holmqvist, K. (2012). It depends on how you look at it: Scanpath comparison in multiple dimensions with MultiMatch, a vector-based approach. Behavior research methods, 44(4), 1079-1100. https://doi.org/10.3758/s13428-012-0212-2
Dijkstra, E. W. (1959). A note on two problems in connexion with graphs. Numerische Mathematik, 1(1), 269 - 271. https://doi.org/10.1007/BF01386390
Jarodzka, H., Holmqvist, K. & Nyström, M. (2010). A vector-based, multidimensional scanpath similarity measure. In ETRA ‘02: Proceedings of the 2010 symposium on eye tracking research and applications, ACM, New York. https://doi.org/10.1145/1743666.1743718